New York Times graphics style. White background #F9F9F7.
Clean editorial. Serif headline. One accent color. Square format.

HEADER:
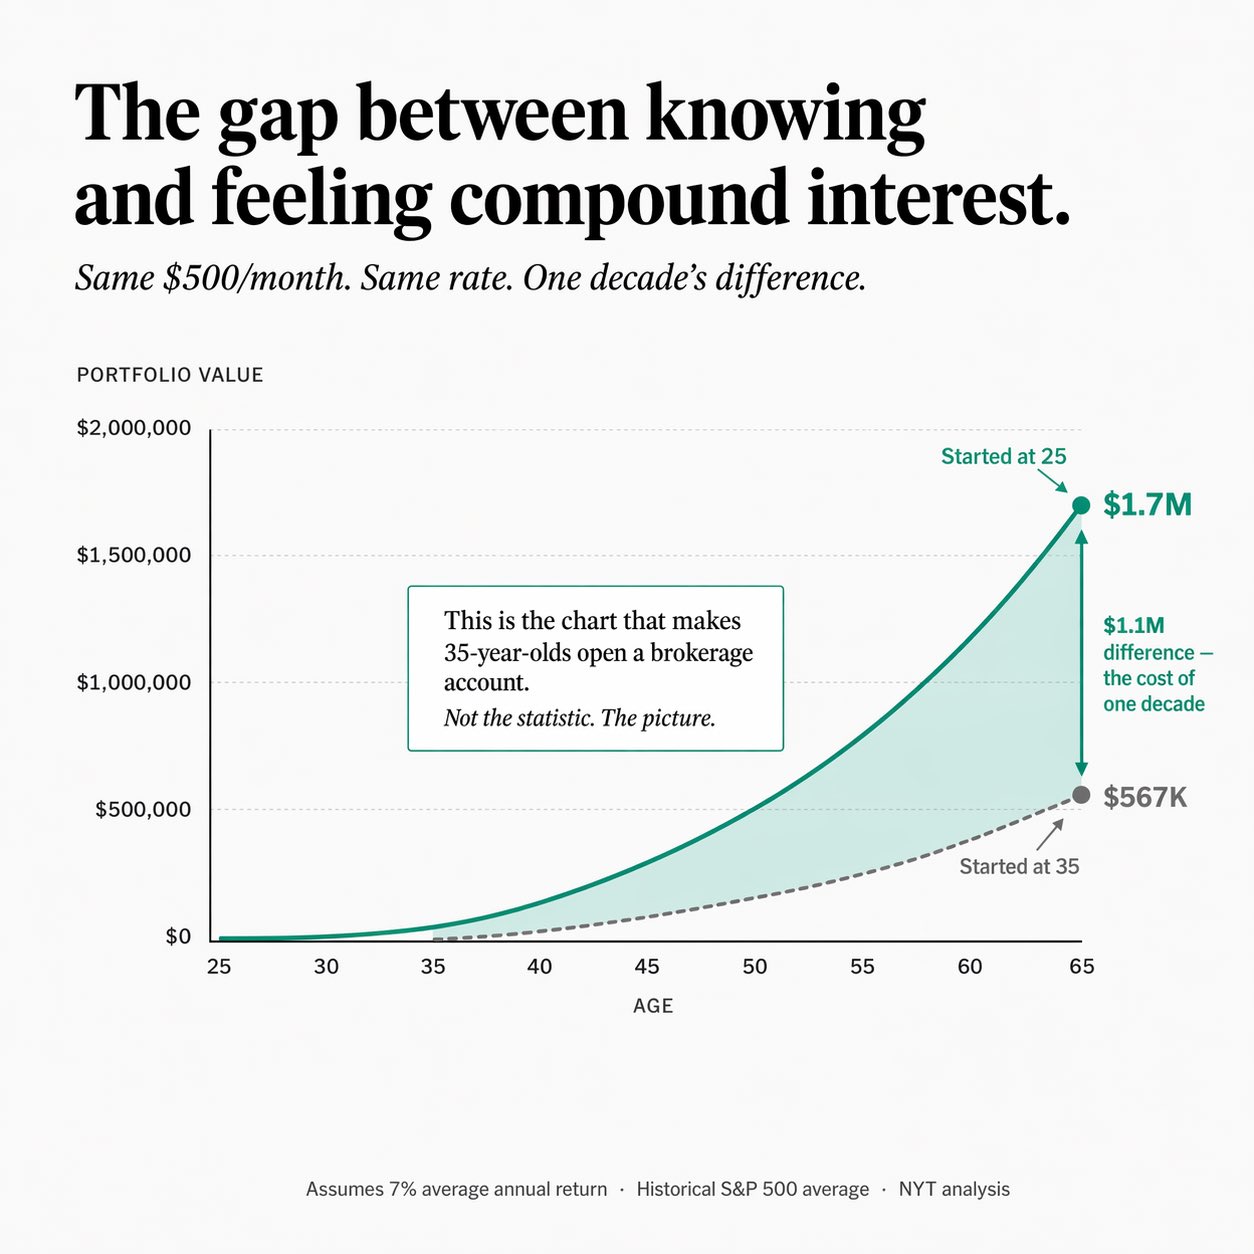
  Serif bold headline (left-aligned):
    "The gap between knowing and feeling compound interest."
  Italic subhead: "Same $500/month. Same rate. One decade's difference."

CHART AREA: Side-by-side area chart or two-line comparison.
  X-axis: Age 25–65. Y-axis: portfolio value in dollars.

  LINE A (solid teal/blue #1A7F64): Starts at age 25. Curves exponentially.
    Annotation inline at age 65: "$1.7M" in bold teal.
    Label above line: "Started at 25"

  LINE B (dashed gray): Starts at age 35 (dormant before that — flat zero).
    Annotation at age 65: "$567K" in gray.
    Label: "Started at 35"

  SHADED REGION between the two lines at age 65:
    Light teal fill (#1A7F64 at 12%). Arrow annotation:
    "$1.1M difference — the cost of one decade"

ANNOTATION CALLOUT (white box with thin border, placed in middle of chart):
  "This is the chart that makes 35-year-olds open a brokerage account.
  Not the statistic. The picture."

BOTTOM: "Assumes 7% average annual return · Historical S&P 500 average · NYT analysis"2b:["$un
 定格AI图像工坊
 使用上传的 4 张图片作为连续变装参考,保持同一位白发短发女性角色,白金色蓬松短发、空气感刘海、精致真实五官、甜酷气质、
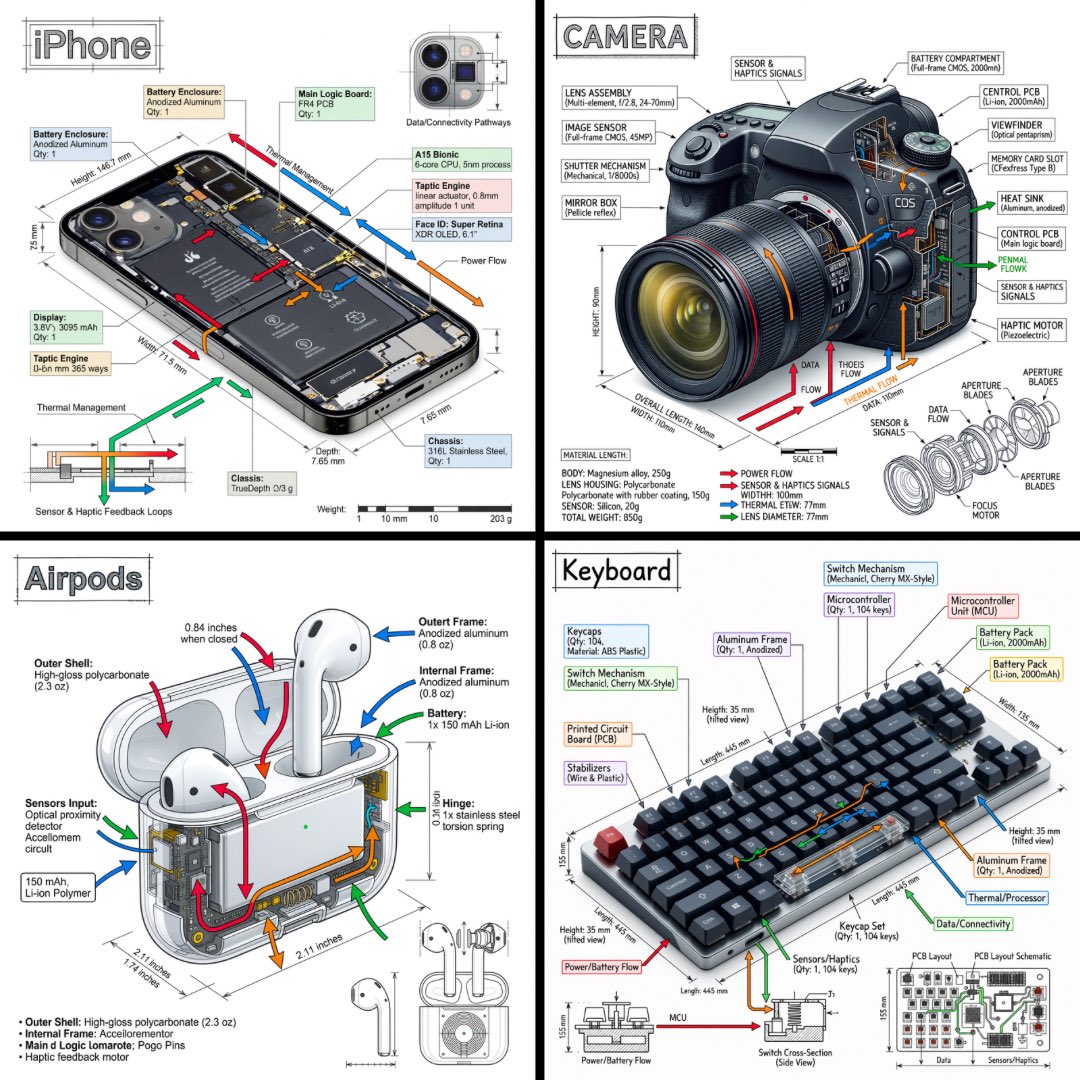 Create a technical infographic of [OBJECT] with a 45-degree
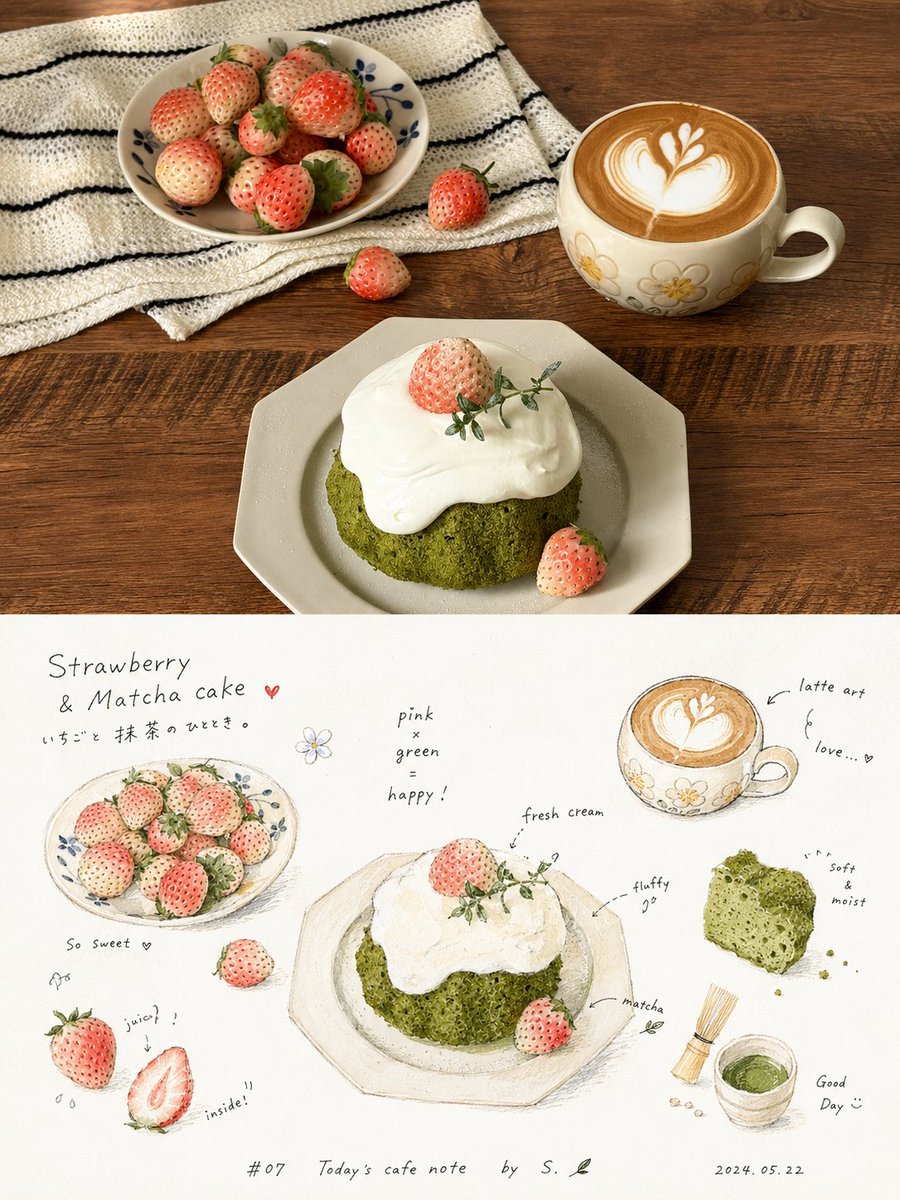
 Transform the uploaded photo into a whimsical hand-painted s
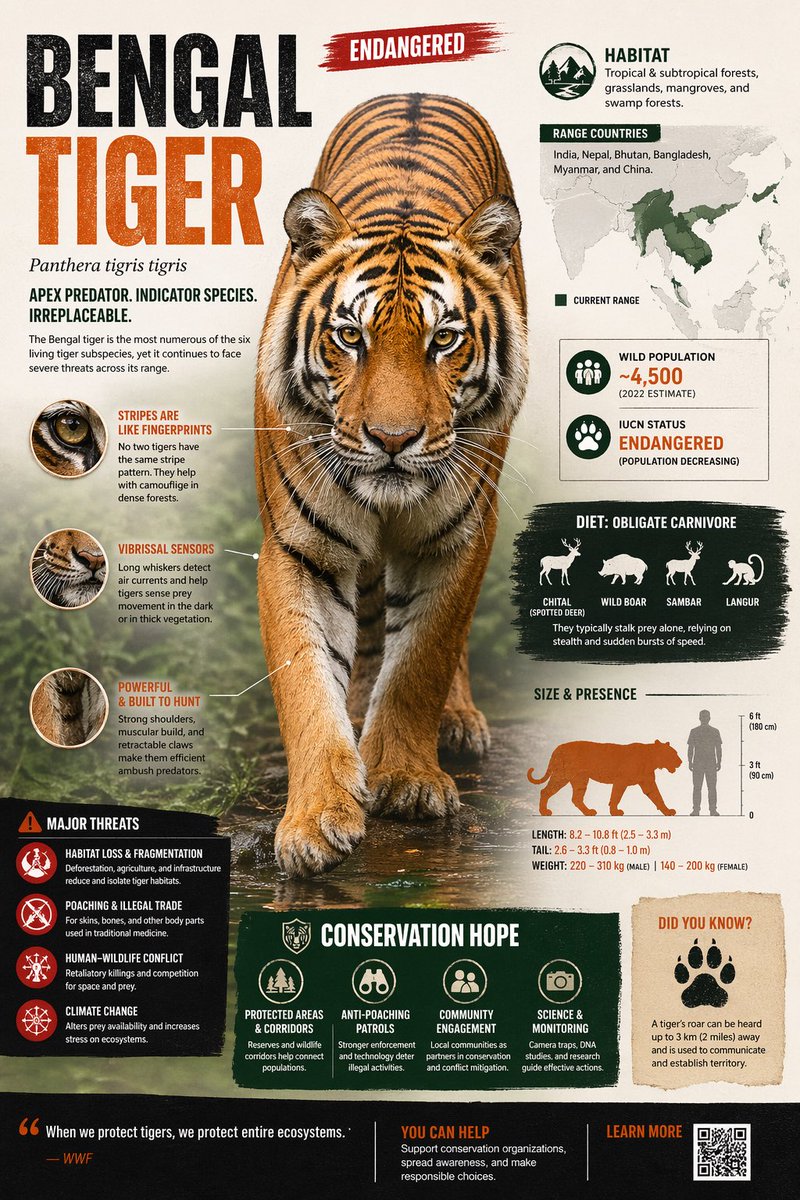 Create a visually rich infographic about an endangered anima
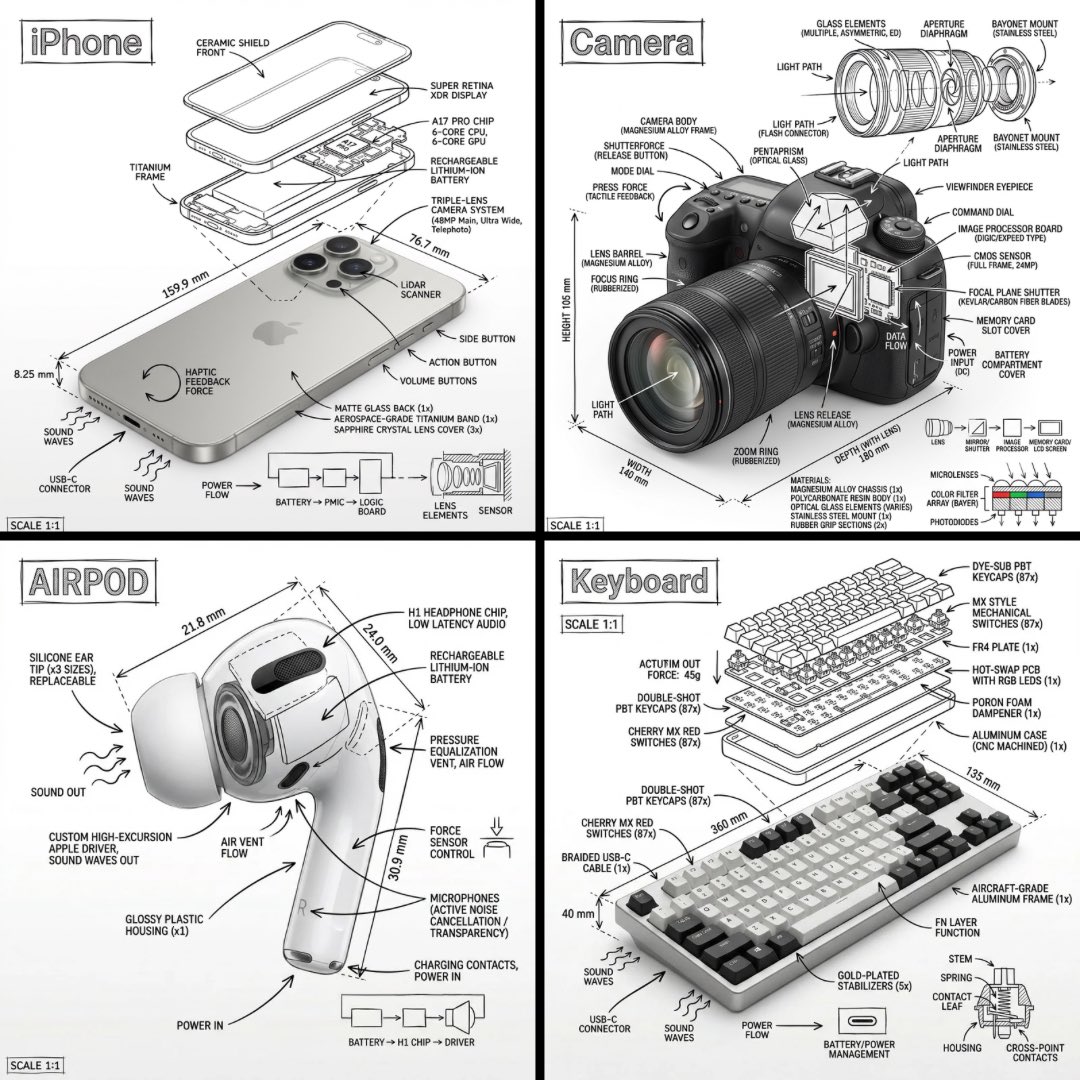 Create an infographic image of [OBJECT], combining a realist
 Conceptual transformation, organic mushroom growth shaping a
 MASTERPIECE anime character dossier poster, ultra-detailed m
 请将我上传的每一张照片分别制作成一张独立的高级设计海报,不多图拼接,每张照片单独输出。整体采用3:4竖版构图,上下两个区